Marketing performance overview
What's behind your eCommerce data?
Check out the marketing report that covers all aspects of your marketing effort.
- How channels support each other in customer acquisition
- Cross-channel attribution
- Effect of discounts
- Patterns of converting behavior
- Top product categories with high retention
Example of a tailored marketing report
Wondering what you will see in the report? Take a look at the example!
Key metrics 2021
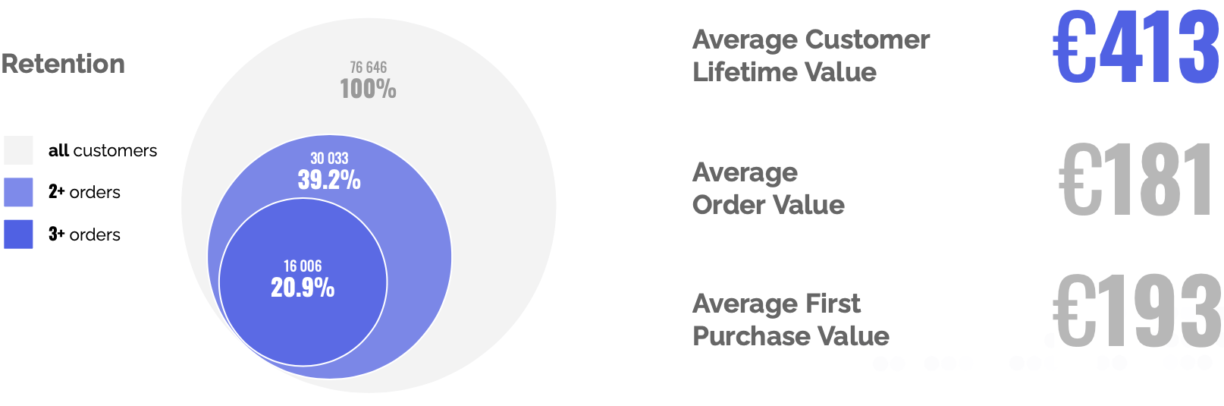
Why you should track these metrics?
Key metrics such as LTV, AOV, FPV, and Retention rate are important to plan your marketing activities and assess performance and growth of your business.
Customer Lifetime Value (LTV) multiplied by product margin indicates how much you can spend on acquisition and retention of a customer. It can be viewed as an upper threshold for acquisition costs—anything that goes above will not pay off.
First Purchase Value (FPV) (or Average Order Value) * product margin is the lower threshold. For eCommerce, where most of the customers are one-time buyers, it’s a rule of thumb that acquisition costs must be covered with a first purchase.
However, with that high retention rate, it is acceptable to overpass “the lower threshold.”

The effect of discounts
Discounts lead to higher average order value (€201 vs €178) and higher lifetime value (€513 vs €409).
Your customers also get 6% more loyal if they buy with a discount. Their retention rate increases up to 41.3% while those who pay full price tend to return a bit less often—39.1%.
LTV to AOV ratio of top sales subcategories
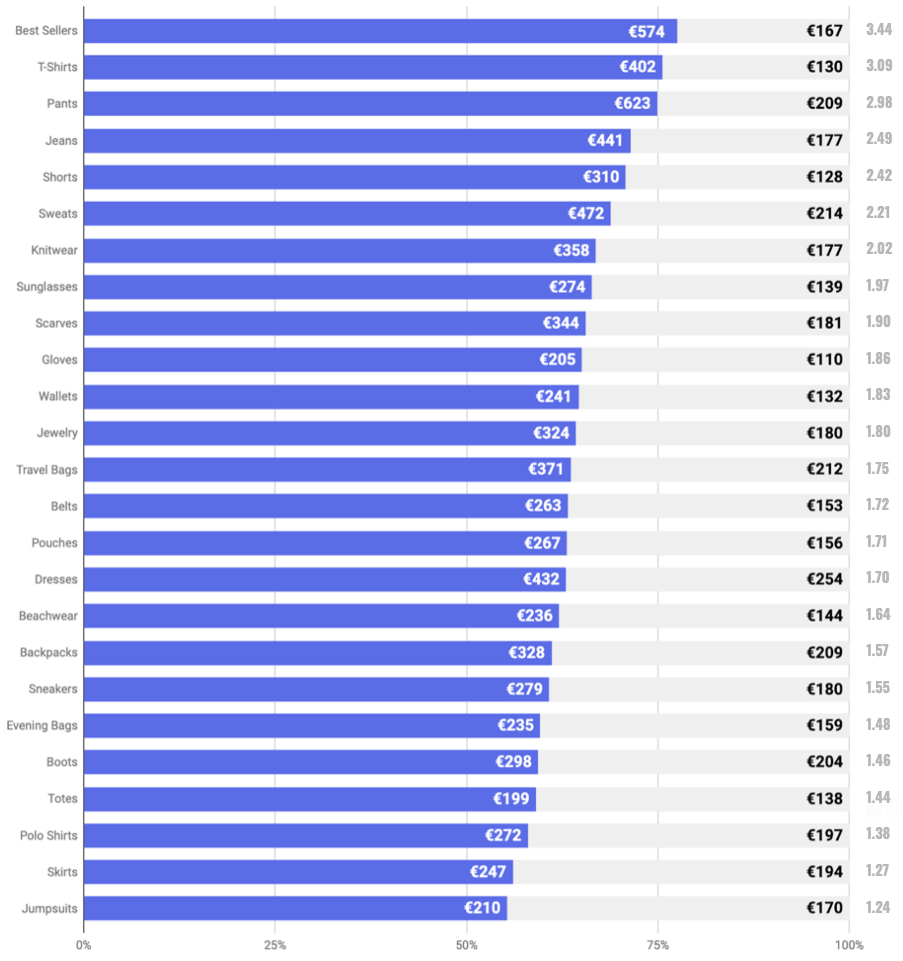

Top 16 popular categories with high retention
Buyers of T-Shirts are the most loyal customers product-wise. They have 60% higher retention than average: 62.8% vs 39.2%.
The most popular subcategory—Best Sellers—leads to a second purchase in 46.7% of cases.
Predicted revenue from 2021 customers
Based on historical data, customers who made their first purchase in 2021 are predicted to bring you additional €1.37M to the current revenue within 1 year of their lifetime.
For example, April customers have spent €423K within first month, or €659K since April to November. They are predicted to spend additional €110K by April 2022 (€768K in total).
In general, 2021 customers show higher growth than ever in history of your shop. January customers have already spent €627K by the end of November, while the predicted value by January 2022 was lower—€597K. It is highly likely that the prediction of additional €1.37M will be exceeded.

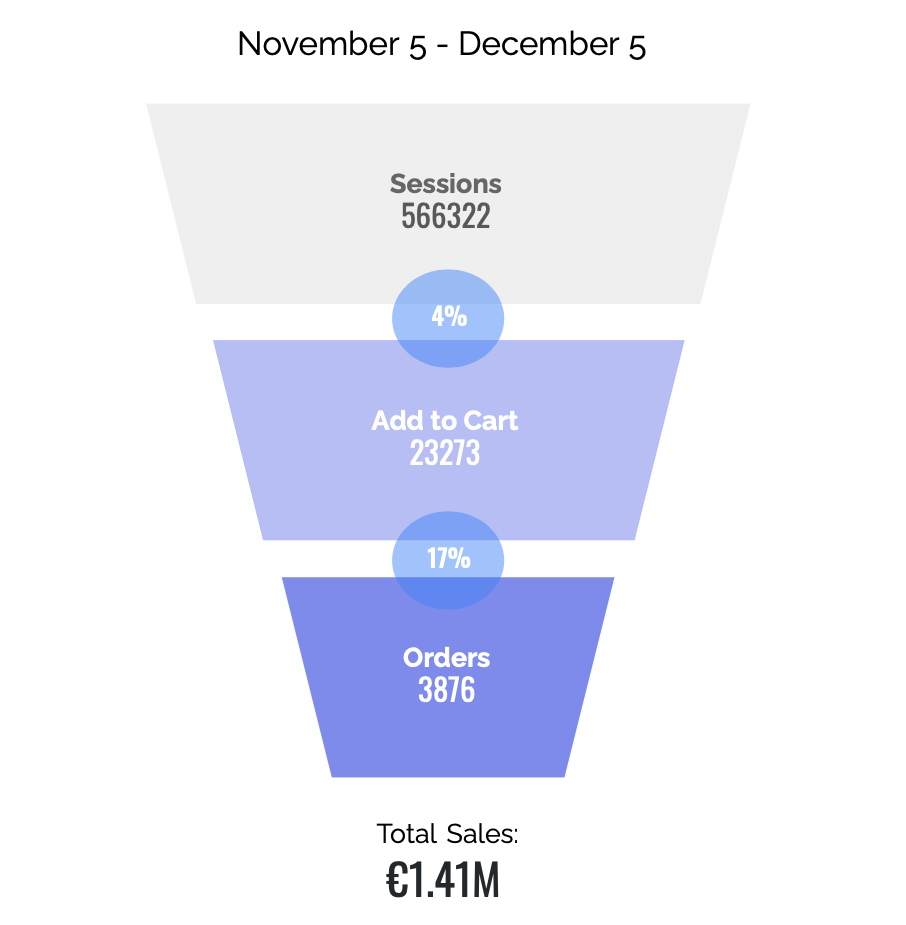
Sales funnel
The sales funnel analysis shows the point where your sales might be leaking.
The add to cart rate is only 4% which is low compared to the Order rate.
Increasing the ATC rate from 4% to 7%, will give you additional 17 454 Added products to the cart and 2907 additional Orders. If we are taking the current AOV €233, for additional 2907 Orders we can expect €677.3K of additional sales.
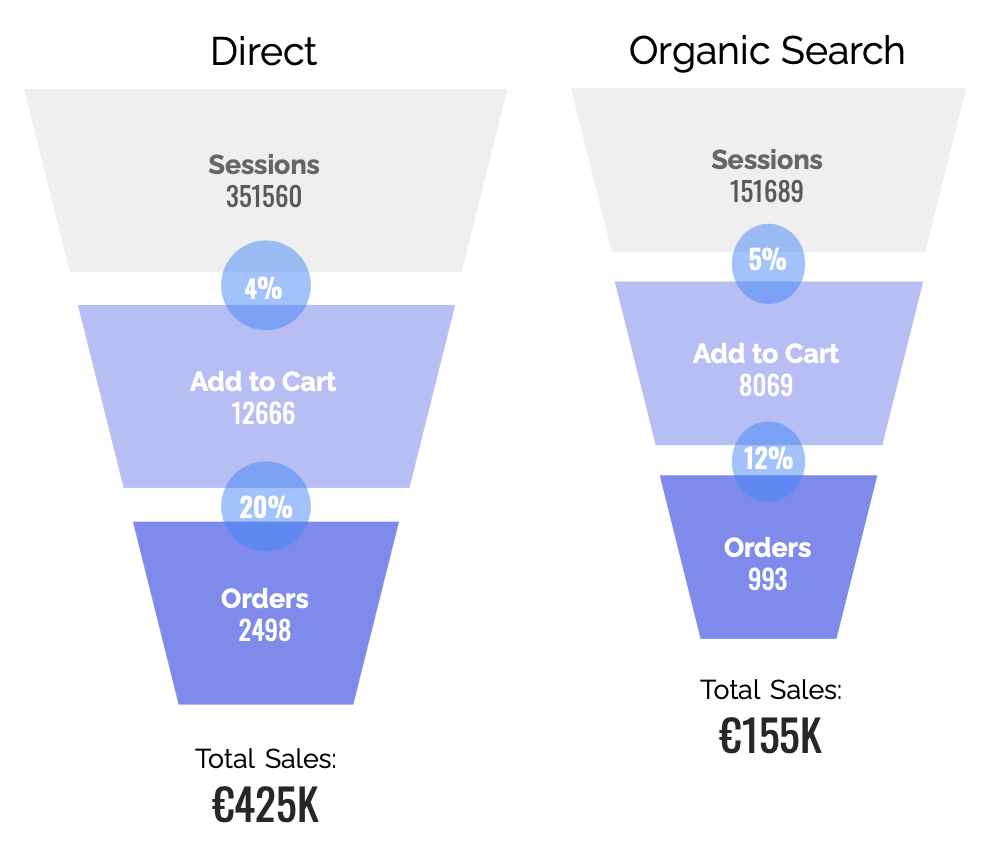
Sales funnel for Direct and Organic Search channels
Sales funnels for Direct and Organic Search shows different results in Orders and similar results for Add to Cart.
The similar add to cart rate (4-5%) indicates issues. Organically attracted visitors are not interested in buying the products, or they need a “push” (discount) for becoming interested.
Consider starting using remarketing and on-site marketing to encourage visitors to add products to cart.
FIRST PURCHASE | NEXT PURCHASE | COUNT |
T-Shirts (Men) | Jeans Pants Jackets Sneakers Knitwear Boots | 397 300 271 206 170 167 |
Jackets (Men) | T-Shirts Pants Sneakers Boots | 328 159 105 100 |
Jewelry | Sunglasses Watches | 115 100 |
Ankle Boots | Boots | 154 |
Dresses | Jumpsuits Shoulder Bags | 234 135 |
Tops | Shorts Skirts | 126 110 |
Sales funnel for Direct and Organic Search channels
The table shows most popular subcategories that customers buy first and subcategories that they tend to buy in their following purchases.
If a customer purchases a product from the first column, it is likely that he/she will purchase a product from the second column later.
Use these pairs to cross-sell your customers. It may be a great way to improve your email marketing making it personalized and high-performing.
Top product pairs
- Action: Use the pairs to cross-sell your customers (e.g., with email marketing).
FIRST PURCHASE | NEXT PURCHASE | COUNT |
Basel long-sleeved T-Shirt | Contrast-stitched Jeans | 219 |
Long-sleeved cotton Shirt | Wool-blend twill Pants | 111 |
Croco leather Belt | Trifold leather Wallet | 82 |
Aliane patchwork linen Dress | Leather pumps | 79 |
Turtleneck stretch-jersey Top | Stretch-jersey Leggings | 73 |
Belted puffer Coat | Leather gloves | 72 |
Cashmere Hat | Cashmere and silk scarf | 70 |
Cotton-blend Sweatpants | Cotton sports Bra | 69 |
Medium shoulder Bag | Mini leather card Holder | 57 |
18K gold earrings with Diamonds | 18K gold necklace with Diamonds | 56 |
What are the chances a visitor will return?
- Action: Consider creating remarketing strategy for getting back the first time visitors.
On average, 17.4% of visitors return for a second session.
The longer is the first sessions, the more chances that a visitor will return. Sessions longer than 6 minutes increase this chance by 2.5 times compared to shorter ones: from 13.3% to 34.7%.
Visitors who spend more than 30 minutes in the shop have 47.6% chance to come back again.
However, those who come from Organic Search tend to return 30-35% less. For sessions shorter than 6 minutes the impact is even more significant: the chance of a second session drops by 60%, on average.
Patterns of converting* behavior
- Action: Set up on-site marketing tools (e.g., pop-up banners) to incentivize visitors who are likely to convert.
The average conversion rate* is 9%.
Users performing 11-15 actions on the website show a huge increase in add to cart probability—up to 90%. Those who do not add to cart by that moment have 23.1% chance of a conversion.
Performing a search increases chance of conversion 3 times, on average, ranging from 38.5% to 84.9%. However, if there was no conversion after 46 actions performed, the conversion rate starts to decrease.
* Conversion in terms of this behavioral analysis means adding a product to cart. It is based on unique users, not sessions.
- Action: Offer incentivization to users who did not add to cart before the average conversion points.
Average amount of actions users perform before a conversion is 111. This is the average conversion point for the whole audience.
Mobile users need the least actions before adding to cart—67, on average. Tablet users need almost twice more—116 actions, while for desktop users it usually takes 167 actions.
On-site marketing can be a solution to encourage users to convert better and increase the chance they will add to cart.
On-site marketing suggestions
- Action: Improve customer journey and CR with pop-up banners.
Pop-up banners can improve and personalize user experience helping to achieve your marketing goals.
Pop-up options:
- Some visitors might need a push to become customers. Use Verfacto ML-generated rules to catch potential customers’ attention.
- Create pop-up banners for first-time visitors that intend to leave.
- Show abandoned cart pop-up banners and remind about the added product.

How many times visitors come before conversion?
- Action: Offer discounts to new visitors who are likely to convert.
70% of conversions happen during the first session. That’s higher than the average in ecommerce. That also means that you need to give more attention to newcomers, as 85% of them will never return.
How do channels support each other in customer acquisition?
- Action: Try new acquisition channels (e.g., Paid Search) and see how they perform.
88% of the traffic come from Organic Search and Direct channels. Both channels show good conversion rates around 9%.
Referral features the highest conversion rate of 13.8%, while Social has the lowest—6.1% only.

Does an acquisition channel matter for conversion?
- Action: Try out new paid marketing channels to get back missed sales. A retargeting campaign may be a good start.
Most of the customers who do not convert during the first session, return to purchase directly.
Still, half of the traffic coming from Organic Search keeps visiting the shop from Organic Search.
The only supporting channel for organic traffic (Organic Search and Direct) is Referral. Only around 4.5% of all conversions attribute to Referral, but at the same time it has the highest conversion rate.
For returning visitors, it’s 22.8% vs 16.6% if they first come from Organic Search and 25.2% vs 20.4% if they first come directly.
Email channel does not perform
- Action: Improve email marketing.
While Email is an effective remarketing channel, it currently does not perform well. As a last-click channel, it lowers conversion rate of acquisition channels by almost 2 times.
For example, when users who first came from Organic Search, have average CR of 16.6% if they come back again. However, if they later come from Email, this chance drops almost twice—from 16.6% to 9%.
This indicates that email marketing could be improved.
For visitors who have not converted yet, a time-limited special offer might help (discount, free shipping, small gift, etc.).
To improve email marketing for existing customers, try using Verfacto’s product/category pairs to offer them what they are likely interested in.
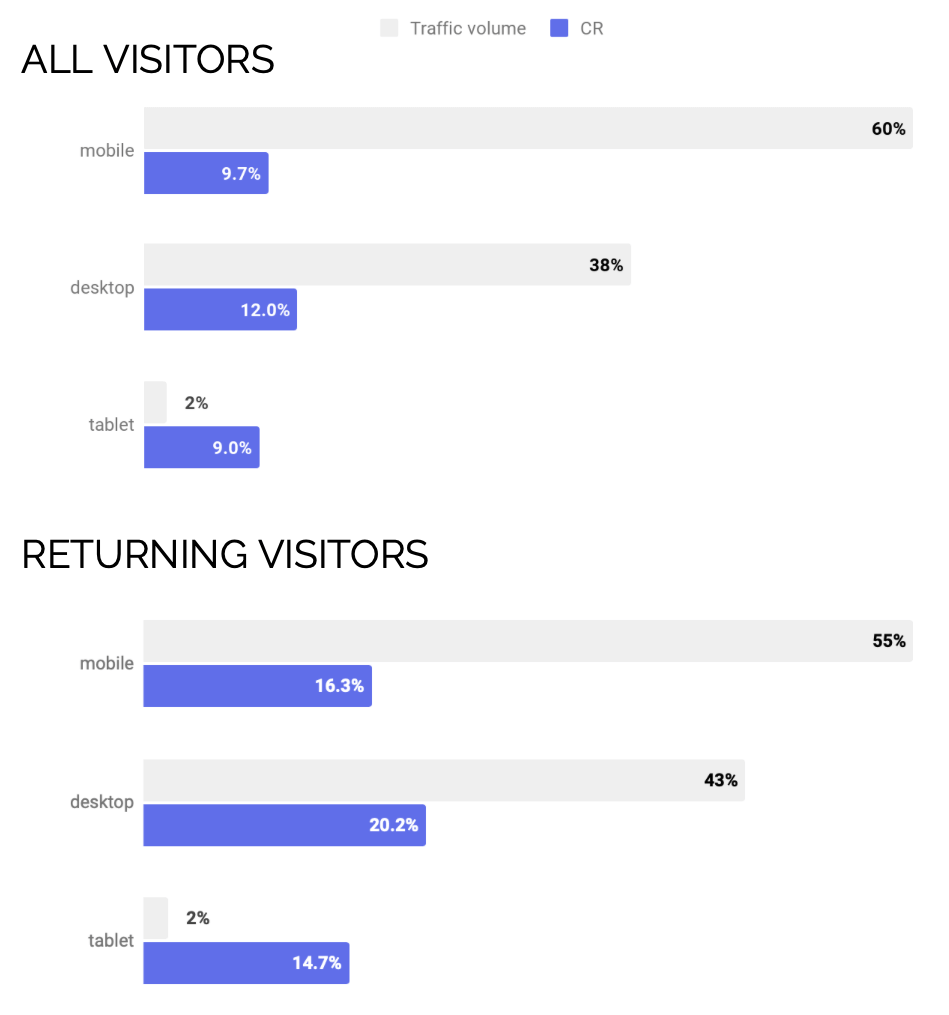
How does device type affect conversion?
- Action: Review UX and performance on mobile.
Mobile traffic slightly prevails over desktop (60%), although desktop traffic is still quite high (38%) for eCommerce in 2021.
Overall, desktop users show 24% higher conversion rate, on average. Usually this indicated UX issues on mobile version.
How does OS affect conversion?
- Action: Review UX and performance on mobile.
Particular OS does not affect much.
Both Android and iOS have similar conversion rate of 9.6-9.7%. Desktop users perform significantly better with 12-12.5% conversion rate.
Still, this may indicate issues with usability and performance on mobile devices. If possible, review UX and performance of the mobile version.
